 (925) 293-3313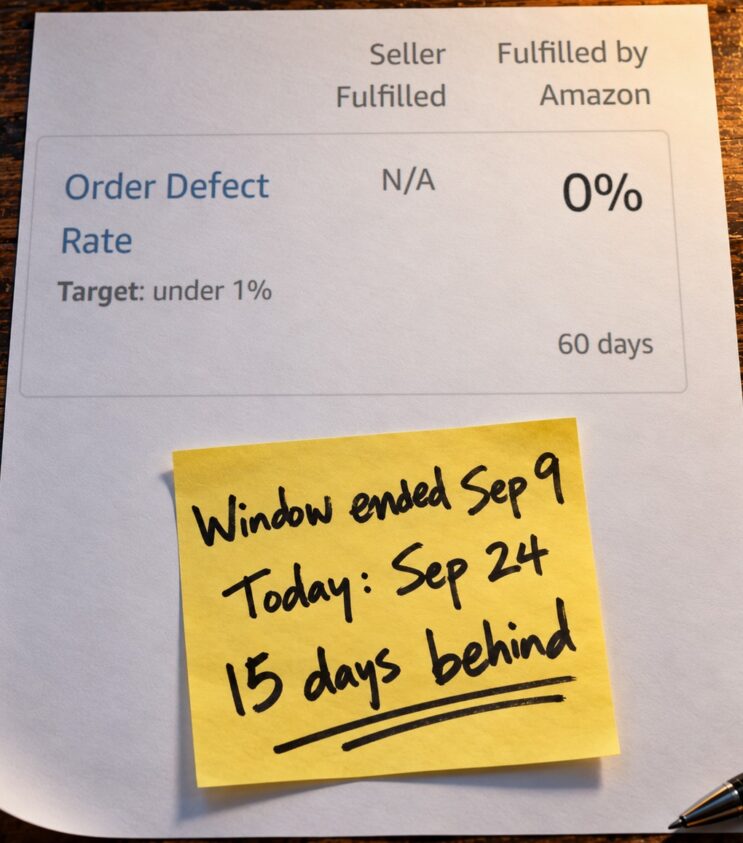
The desk photo is generated. The card on the paper is our real September 24 capture, narrowed to phone width, with the line that showed its order count painted out.
Every time we read the Amazon Order Defect Rate (ODR), the 60 days behind it had ended about two weeks earlier. The ODR is the share of your orders, over a 60-day window, that had a defect: a bad seller review, an A-to-z Guarantee claim or a chargeback. You find it under Performance > Account Health, on the Customer Service Performance card in Seller Central, Amazon’s dashboard for sellers.
On an account we run, that card had two columns: Seller Fulfilled, for orders the seller ships, and Fulfilled by Amazon, for orders Amazon ships. The first read N/A and the second 0%. At a glance, both looked fine.
The N/A meant there were no orders to score, which says nothing about how well that part of the business runs. The 0% looked better, but it covered a window that had already closed.
Amazon’s Order Defect Rate policy requires sellers to keep it under 1%. Go over, and the policy says it may suspend your selling privileges for the orders you ship yourself, or deactivate seller-fulfilled offers with high defect rates.
Before you trust the number, check which fulfillment column it sits in and which 60 days it covers.
Step 1: Find your Order Defect Rate and check its column
Select Menu at the top left of Seller Central, then Performance, then Account Health.
The card reports the rate once for each fulfillment channel. The Seller Fulfilled column covers orders you ship yourself, also known as fulfilled by merchant. Amazon’s policy scores seller-fulfilled orders, so watch that column if you ship orders yourself.
If you sell only with Fulfilled by Amazon, the policy doesn’t score that figure, but the card still prints it.
On September 24, our Seller Fulfilled column had no orders in the window. Fulfilled by Amazon read 0% across more than 40 orders.
Step 2: Open the detail page
Select View details at the bottom of the card, or use the Customer Service Performance tab at the top of Account Health. Both open the same detail page.
Near its top, the Fulfilled by selector switches the rate and the two counts between Seller and Amazon. Start with Seller. At the top right, Time Window shows the 60 days the rate covers.
Under each choice you’ll see Orders with a defect and Total orders. Read the two counts before the rate, because a percentage means little until you know how many orders sit behind it.
A defect table on the same page splits the defects by kind, in rows labelled Negative Feedback, A-to-z Guarantee claims and Chargeback claims. Seller feedback, which the table calls Negative Feedback, is the star rating a buyer leaves for an order, not for the product. Amazon’s chargeback guide says it counts when it is under three stars.
An A-to-z Guarantee claim is a buyer’s claim under Amazon’s protection for problems with delivery, item condition or returns. It counts when Amazon grants it against you, and not when Amazon denies it or finds you not at fault. Amazon’s policy page lists the edge cases.
A chargeback is a payment dispute through the buyer’s bank. It counts when the bank sides with the buyer over a service problem, such as a parcel that never arrived, and only on orders you shipped yourself. A fraud chargeback, such as a stolen card, doesn’t count. An order with two defects counts once.
Step 3: Read the time window
Check Time Window on the detail page. Its dates move forward from one visit to the next, and the gap between its end date and today’s date is how old your number is.
We expected that window to end on the day we looked. It never did. On September 24, for example, the page printed Jul 12, 2026 to Sep 9, 2026.
We opened the page on seven separate days in September, on two accounts we run, and the window had ended about two weeks before we looked every time:
| Day we opened the page | Window it printed | Days the window lagged |
|---|---|---|
| September 9, 2026 | June 27 to August 25 | 15 |
| September 16 | July 4 to September 1 | 15 |
| September 17 | July 6 to September 3 | 14 |
| September 24 | July 12 to September 9 | 15 |
| September 26 | July 14 to September 11 | 15 |
| September 29 | July 17 to September 14 | 15 |
| September 30 | July 18 to September 15 | 15 |
Six of the seven readings lagged by 15 days. September 17 lagged by 14.
Amazon’s page doesn’t say why the window runs behind. In a 2022 Amazon seller forum thread, one seller describes the same delay of about 14 days and says it gives buyers time to receive an order and react to it. That is one seller’s guess, not Amazon’s word.
A worked example: the defect the number hasn’t seen yet
The September 17 reading and its dates are real, from the table. The counts, and the September 10 order and its feedback, are made up.
Say you ship your own orders, so your number sits in the Seller Fulfilled column. On September 17 the page prints July 6 to September 3.
The window holds 460 orders. Four of them picked up a defect. Four out of 460 is 0.87%, under the 1% target.
Say a fifth buyer ordered on September 10 and left two-star feedback about a crushed box before September 17. September 10 is after the September 3 end date, so the 0.87% can’t see it yet. Once the window reaches September 10, five out of 460 is 1.09%, over the target.
The 0.87% was already out of date the day you read it, and nothing on the number itself flagged it.
The sums are simplified. Amazon’s policy page dates feedback and chargebacks by the order date. This example uses seller feedback, so we use the order date here. We also assume steady volume and ignore older orders leaving the window.
What the number can’t show you
It can’t show you the orders that haven’t reached the window yet, so treat a rate near 1% as a warning to act on now. If the rate is climbing, compare Total orders and the defect table on the detail page from one visit to the next, and write both down each time you look. The rate can rise because defects grew or because older orders left the window, and the table shows whether any of the three kinds grew.
If one kind grew, look at its orders under Performance: Feedback Manager for seller feedback, A-to-z Guarantee Claims for buyer claims, or Chargeback Claims for payment disputes.
A fix that only affects new orders won’t show up in a window that ended two weeks ago. Wait for a window that ends after your fix, and expect it to still hold some older orders.
If your rate is under 1%, check the Time Window end date anyway: it is the last day your number can see.
Written by Josh Hackett and the EHP Consulting Group team, who manage Amazon accounts for brands day to day. If your rate is rising and you want a second look, see our Amazon account audit or our guide to navigating account deactivation. We last read the Time Window in Seller Central on September 30, 2026.